DATA STORY
Percentage of evenly spaced Muni arrivals
Monthly percentage of evenly spaced Muni arrivals, also known as headway adherence
Controller's OfficeMeasure description
This is a measure of the percentage of Muni vehicles that arrive at evenly spaced times at stops along the route (also known as headway adherence). For example, on some lines Muni buses should arrive every 15 minutes rather than arrive at a set time for each stop. An arrival is considered evenly spaced if its gap from the previous vehicle is no more than 5 minutes longer than the scheduled headway interval.
Why this measure is important
Reporting on the percentage of evenly spaced Muni arrivals provides the public, elected officials, and City staff with a current snapshot of SFMTA’s transit performance. SFMTA's goals include delivering Muni service that is fast, frequent, reliable, clean, and safe. Ensuring frequent service involves preventing Muni arrivals for buses and light rail vehicles from bunching up at stops and/or seeing major gaps until the next one arrives. This means riders can rely on buses arriving at predictable intervals.
The interactive chart below presents SFMTA’s percentage of evenly spaced Muni arrivals.
Percentage of evenly spaced Muni arrivals
Navigating dashboards with a keyboard
- Control + Enter to enter the dashboard
- Tab or Arrow to move between visuals
- Control + Right arrow to enter a visual or filter
- Escape to exit a visual, filter or dashboard
Navigating within a visual or filter
- Tab or Arrow to move around a table or visual
- Enter to select within a table or visual
- Spacebar to select or deselect a filter
Data notes and sources
All headway adherence data comes from SFMTA. Headway adherence data is reported with a one-month lag. For example, May’s data will be available at the end of June.
Chart legend:
- Y-axis: Percentage of evenly spaced Muni arrivals
- X-axis: Month and year
How performance is measured
The percentage of evenly spaced Muni arrivals is calculated using the following methodology:
An arrival is considered evenly spaced if its gap from the previous vehicle is no more than 5 minutes longer than the scheduled headway interval.
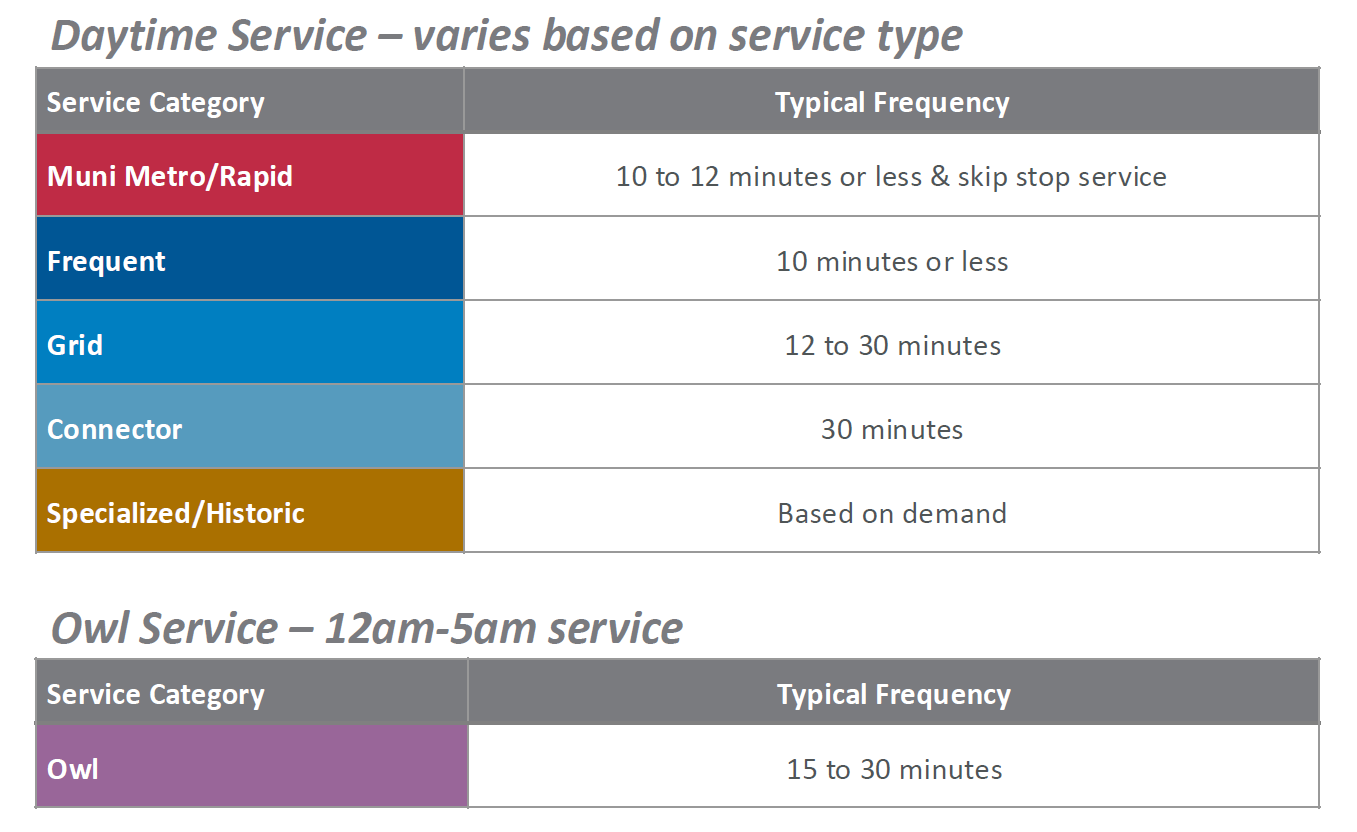
SFMTA's headway policies from their Muni Equity Working Group slides are shown below. Connector and Owl routes are not measured by headway adherence; instead, they use a traditional schedule‑adherence (whether or not a vehicle arrives on time) standard.
The number displayed on the scorecard page represents a fiscal year average of the values in the chart above.
Additional information
- View other performance metrics on the SFMTA’s website.
- Learn more about Muni Forward system improvements.
- See the SFMTA's 2023 Annual Report.
- See the SFMTA's Strategic Plan Progress Reports.
City Performance Scorecards
This page is part of the City Performance Scorecards.
Return to the Transportation Scorecard.
Return to the City Performance Scorecards Home Page.