
About the 2026 City Survey
The City Survey asks San Francisco residents how they feel about the quality of City services like parks, libraries, Muni, streets, and utilities. The 2026 City Survey is the 19th survey conducted since 1996. In 2026, the survey collected responses from a random sample of 2,505 San Francisco residents, aged 18 and over, conducted on the phone or online.Overview
Every two to three years, the City Survey asks San Francisco residents how they feel about the quality of City services like parks, libraries, Muni, streets, and utilities. Find more information and data on the City Survey homepage.
The 2026 City Survey is the 19th survey conducted since 1996. In 2026, the survey collected responses from a random sample of 2,505 San Francisco residents, aged 18 and over, conducted on the phone or online.
The survey asks respondents to grade the overall quality of the services provided by the City government, as well as the specific services provided by libraries, parks, and Muni.
The 2026 survey also asked respondents about:
- How frequently they use City services
- The biggest issue facing San Francisco
- How safe they feel walking alone in their neighborhood
- Other timely topics that change each survey, like downtown recovery
We refer to City Survey participants as “San Franciscans,” “respondents,” and “residents” because the survey uses a representative sample that reflects current demographic and neighborhood distributions.
Some averages and percentages changed very slightly from 2023 to 2026. Slight changes are expected in surveys. When a change is so small that our analysis could not determine if it was random chance or a true change, we label the change as “not significant” or refer to it as a “slight” increase or decrease.
More detailed methodology notes for these findings are at the bottom of this page.
All service area ratings stayed stable or increased from 2023
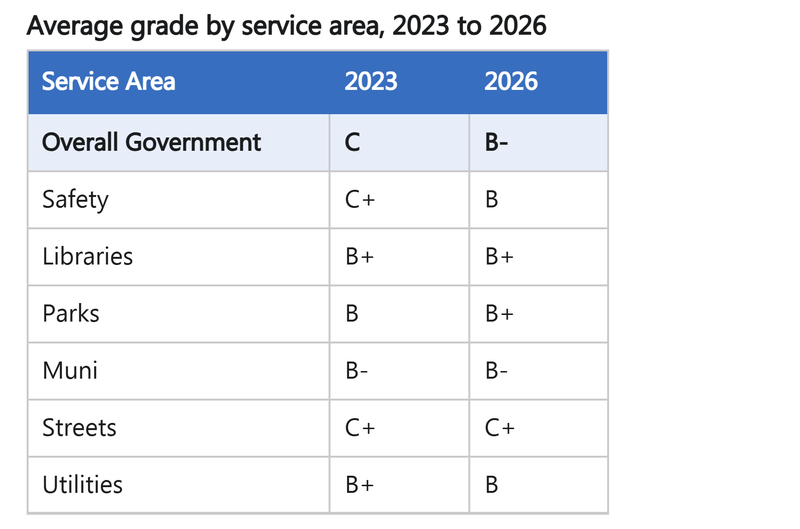
Average ratings for City services in 2026 ranged from C+ to B+. Libraries and parks earned the highest average ratings among City services, continuing a long-term trend.
The average feelings of safety grade and overall government grade showed the greatest increases from 2023 to 2026.
Although parks and utilities changed grade levels from 2023 to 2026, the changes in their average rating were not statistically significant. These slight changes in average rating indicated overall stable service ratings. The changes in grade levels for government and safety service areas reflect a statistically significant increase.
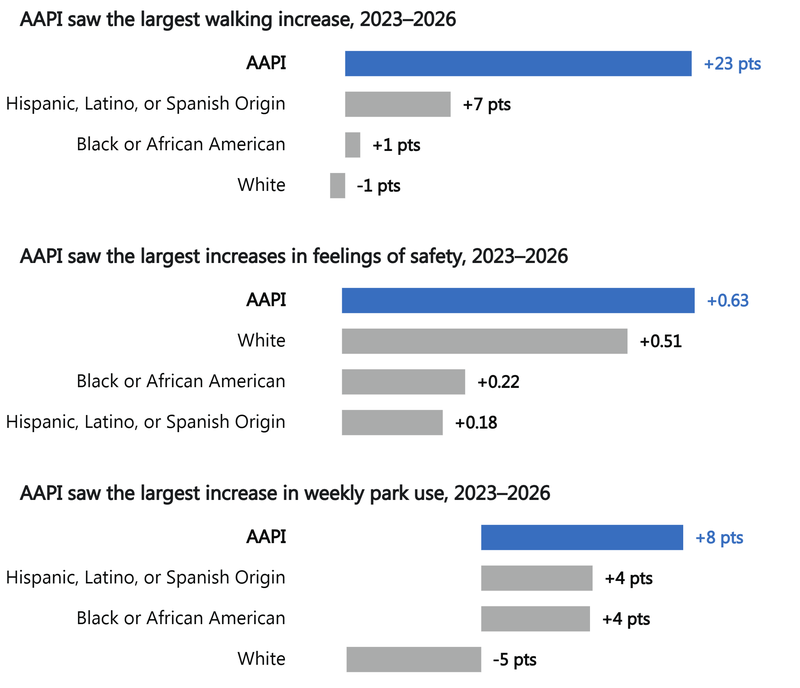
Average ratings for feelings of safety and parks and frequency of walking increased the most for Asian or Pacific Islander respondents
The average ratings for feelings of safety, frequency of walking, and frequency of using rideshare (like Uber and Lyft) increased the most for Asian or Pacific Islander respondents as compared to other race/ethnicities.
The average ratings for these same categories also increased significantly more for families with children between six and 17 years old than for families with younger or no children across all race/ethnicities.
Asian or Pacific Islanders and families with children between 6 and 17 years old also showed large increases in downtown activity, especially for nightlife and shopping.
Average ratings for Asian or Pacific Islander respondents, for example, showed the second-highest increase compared to other race/ethnicities. Increased feelings of safety and greater activity around the city may be especially related for these groups.
Users rated services higher than non-users
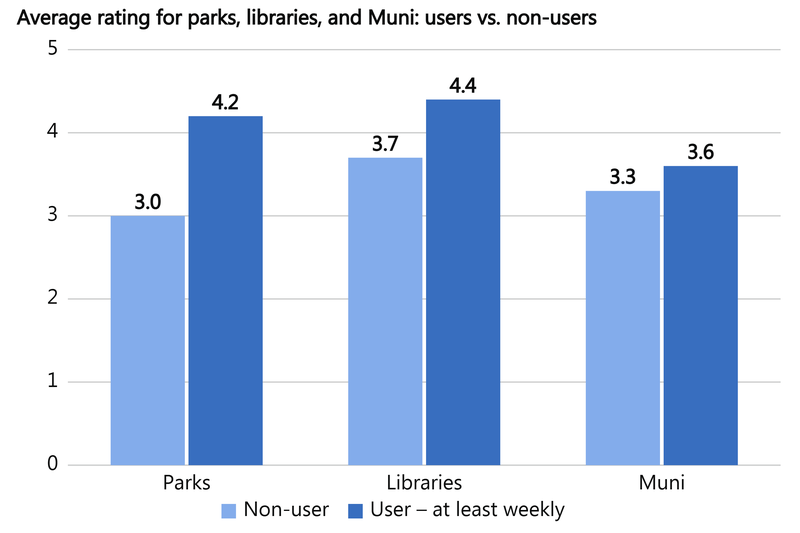
In 2026, users of parks, libraries, and Muni consistently rated services higher than non-users. Higher use frequency (weekly compared to monthly) also often correlated to higher average service ratings.
The table below shows the average ratings for non-users, those who used parks at least monthly or more frequently (including weekly), and those who used parks at least weekly.
Four neighborhoods reported increases across multiple service areas
Residents in the Financial District/South Beach, Outer Richmond, Pacific Heights, and Sunset/Parkside neighborhoods reported increased ratings across several topics between 2023 and 2026.
The boxes below show the four neighborhoods that increased their ratings in the greatest number of service areas.
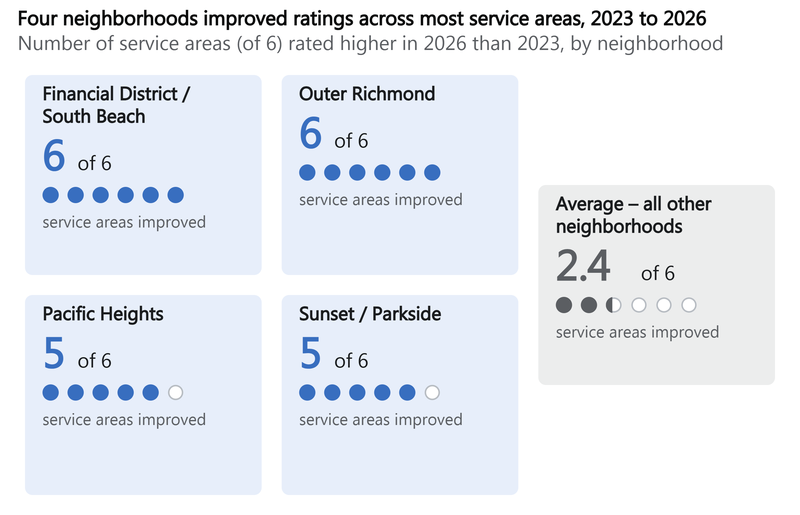
Safety ratings saw the largest increases in all four neighborhoods, with daytime and nighttime safety ratings improving by more than one point on a five-point scale in Financial District/South Beach, Outer Richmond, and Pacific Heights.
Top Issues Facing San Francisco
In addition to questions about specific City services, the City Survey first introduced a section that asks respondents about issues facing San Francisco in the 2017 survey.
First, the survey has an open-ended question that asks respondents to name what they believe the top issue facing San Francisco is. Although the survey asks for the single top issue, respondents have often provided more than one.
Then, the survey asks respondents to report whether four issues got better, worse, or stayed the same in the past year: homelessness, street cleanliness, public safety, and housing affordability.
Homelessness and affordability remain among top concerns
Although the survey asked residents to identify a single top issue, many residents have consistently responded with multiple top issues. The results reflected long-standing and sometimes overlapping challenges voiced by residents.
The respondent quote below reflects some of the key issues brought up by other residents in 2026, illustrates connections between key issues, and acknowledges signs of improvement in the city.
“The most important issue facing San Francisco today is homelessness, housing affordability, and the related challenges of public safety and open-air drug markets. While these are technically distinct issues, residents and city leaders generally view them as a deeply interconnected crisis. The extreme shortage of affordable housing drives homelessness, while a lack of sufficient mental health and addiction resources worsens conditions on the streets, particularly in neighborhoods like the Tenderloin and South of Market (Soma). This combined crisis impacts the city's economic recovery, tourism, and residents' overall sense of safety, making it the top priority for local government and community action."
The chart below shows the percent of all responses that contained each of the top four most frequently cited issues. The chart also shows the percent of responses containing that issue in 2023 to highlight whether each issue was more or less common in 2026.
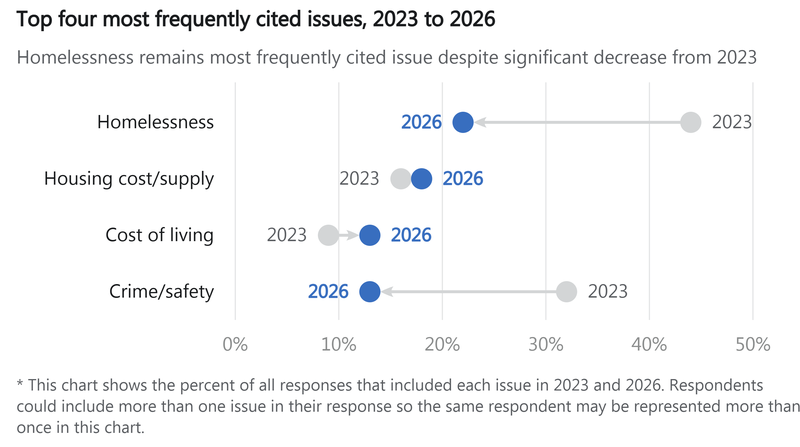
In 2026, homelessness continued to be the most frequently mentioned issues for residents. Respondents have consistently reported homelessness as a top issue since 2015 when City Survey first asked the question. However, the percent of response citing homelessness declined significantly from 2023: almost 50% of all responses cited homelessness in 2023, while only a little over 20% included homelessness cited in 2026.
An increasing percentage of residents named cost of living and housing affordability as top issues for San Francisco. San Francisco has indeed had a recent spike in the cost of housing; from July 2025 to July 2026, median rent increased by 23% and home prices increased by more than 10%.
Residents also frequently mentioned key words such as drug use, crime, and mental health crises. However, these were more often paired with one or more of the issues mentioned above than they were cited alone. Respondents often mentioned these same top issues in a later question asking respondents to explain their rating for feelings of safety.
San Franciscans report that many key issues improved in past year
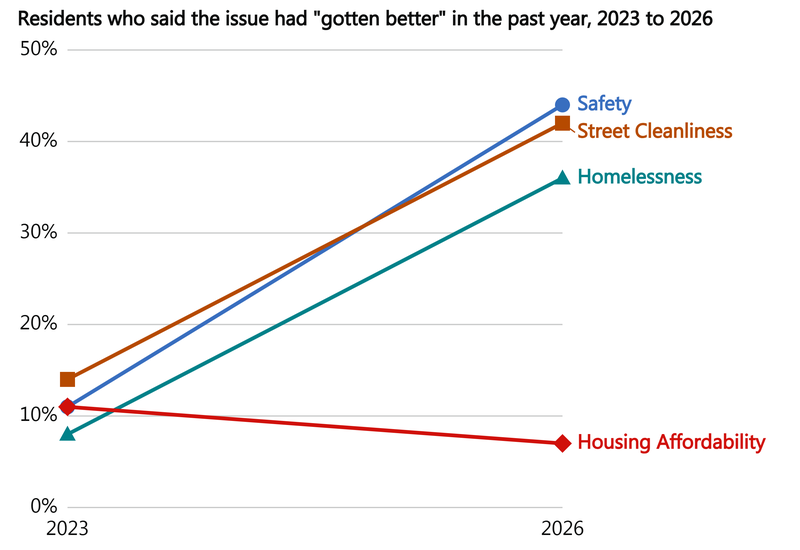
The percent of residents who reported that street cleanliness, homelessness, and public safety had gotten better in the past year significantly increased from the percent in the 2023 survey for each of those categories.
Housing affordability was the only top issue that residents said got worse between 2023 and 2026. The share of respondents reporting that housing affordability worsened went up from 65% in 2023 to 70% in 2026.
Though homelessness remained a key concern for San Francisco residents, a significantly higher percent of respondents reported homelessness had improved in the past year (36%) as compared to the 2023 survey results (8%).
Government Services
Average overall government rating increased from a C to a B-
2026 Overall Government Rating: B-
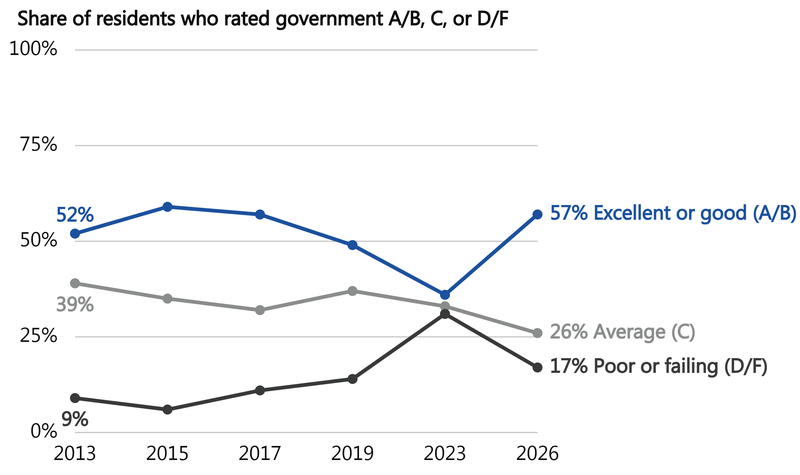
The average overall government rating increased from 2.9 (C) in 2023 to 3.4 (B-) in 2026, improving from “Average” to “Good.” This returned the average rating to its consistent pre-pandemic B- grade, as the average overall government rating remained steady at a B- from 2014 through 2020.
Average overall government ratings saw the biggest increases from White and higher income residents
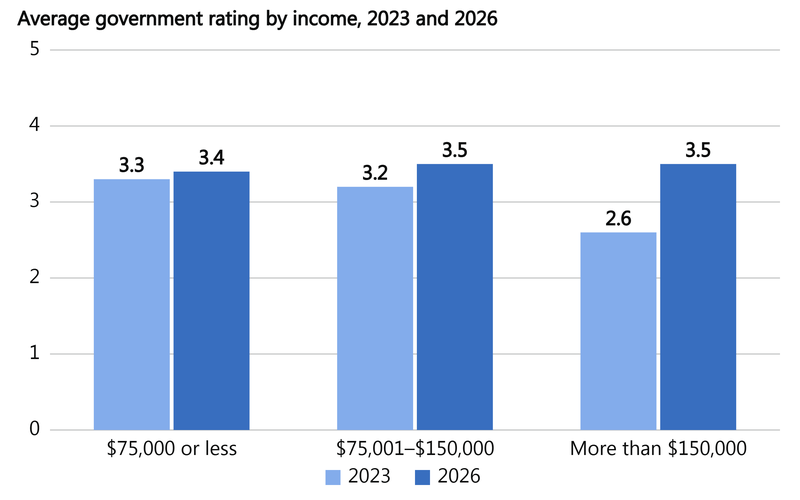
Ratings among higher income earners of overall government services had the biggest rating increases from an average of 2.6 (C-) in 2023 to 3.5 (B-) in 2026. The overall government rating remained stable for lower-income residents. This increase reduced the disparity in average ratings among income groups.
The average overall government rating increased for residents of all races. The average rating among White residents had the largest increase in overall government ratings from 2.8 (C) in 2023 to 3.5 (B-) in 2026. Asian or Pacific Islander respondents had the second largest increase from 3.2 (C+) in 2023 to 3.5 (B-).
Economy
Residents reported participating in more downtown activities
Note: Respondents reported their own employment status. These answers do not reflect other official unemployment metrics from State or Federal sources, which use a different process and definitions. Survey weights adjusted for demographics, but not for labor force benchmarks.
In 2023, the City Survey included a new question asking whether respondents had visited downtown within the past three months. Ninety percent had been downtown in that period: 17% reported they lived downtown, while 73% had visited downtown but did not live there.
The City Survey did not define the boundaries or neighborhoods of “downtown” in these questions. Residents responded based on their own understanding of the term “downtown.”
Residents participated in a more diverse range of downtown activities in 2026 compared to 2023. Nightlife, dining, and shopping saw the largest increases in downtown visits. Work, arts, and cultural events also rose significantly.
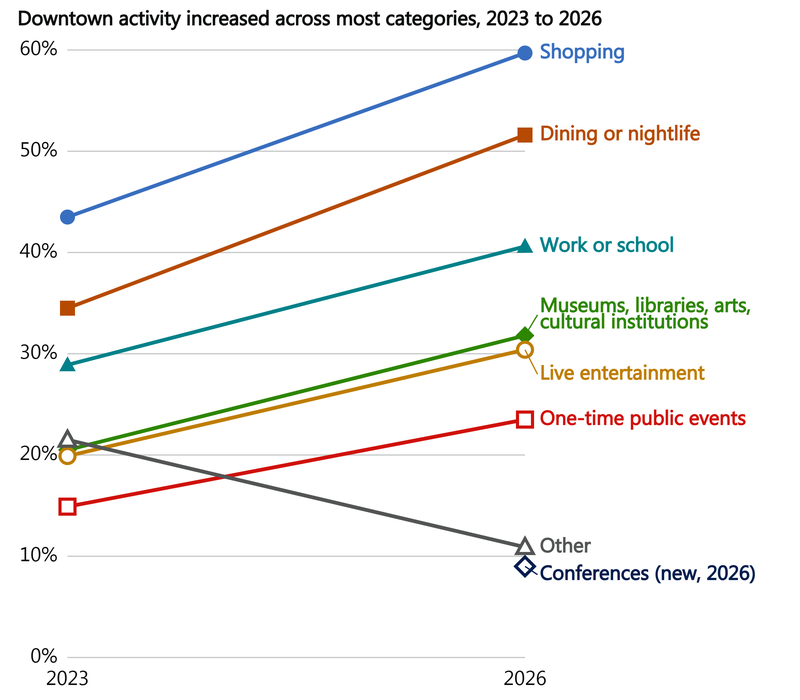
Women (50%) and men (54%) reported similar downtown nightlife and dining participation in 2026. This represented a 21 percentage-point increase for women and a 14 percentage-point increase for men, reducing the 2023 gap between genders. The gap reduction between these two genders also occurred for feeling of safety at night. The two factors may be related.
The survey also asked the respondents who did not visit downtown in the last three months to report their reasons for not visiting. This smaller group of respondents most often described that they did not visit downtown because their interests were more easily available in their neighborhood or online. Respondents also reported accessibility and safety concerns, but less frequently. Accessibility reasons included difficulty with parking, traffic, transportation, and affordability.
Most employed residents commute to work at least 3 days per week
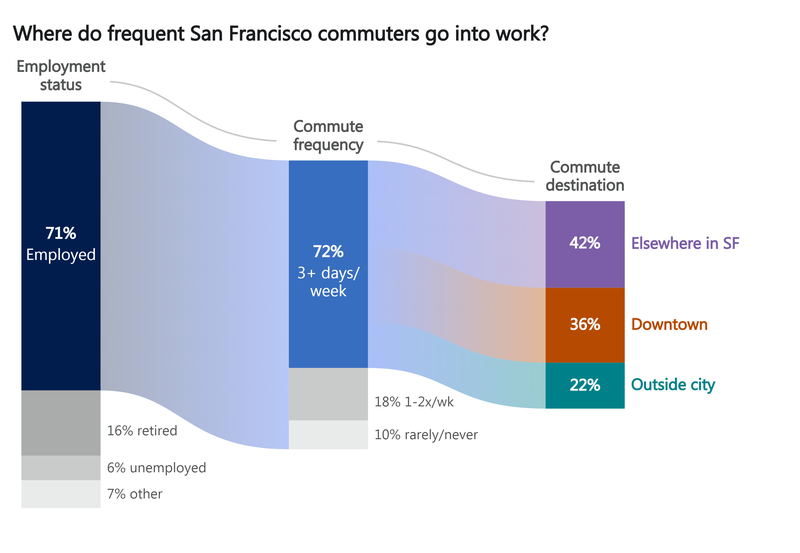
Most respondents in the 2026 survey reported that they were in the workforce: 71% identified as employed, 16% as retired, and 6% as unemployed.
Among employed respondents, 72% traveled to a workplace outside the home at least three days a week, 18% commuted 1-2 days a week, and only 10% rarely or never commuted outside the home.
Of employed commuters, 36% reported their commute was to downtown, 42% to elsewhere in San Francisco outside of downtown, and 22% to outside the city.
Feelings of Safety
Average feelings of safety rating increased from a C+ to a B
2026 Safety Rating: B
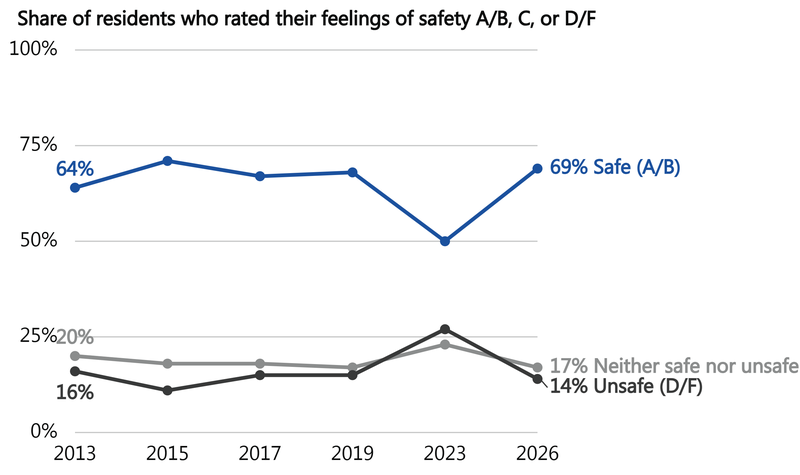
The survey asked respondents to rate how safe they felt walking alone in the neighborhood during the day and how safe they felt doing so at night. The safety grade represents the average of the day and night average ratings.
The average rating for feelings of safety increased from 3.3 (C+) in 2023 to 3.8 (B) in 2026.
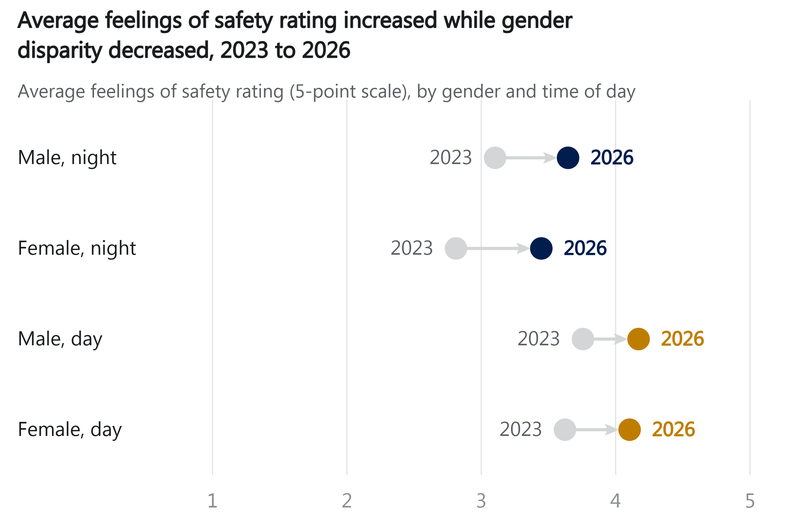
The average nighttime safety rating improved from 3.0 (C+) in 2023 to 3.5 (B-) in 2026. Average daytime safety ratings also improved from 3.7 (B) to 4.1 (B+). Nighttime safety ratings continued to be lower than daytime safety ratings across San Francisco, but saw a larger increase.
Average feelings of safety increased across demographic groups and neighborhoods
All the demographic groups that reported the lowest feelings of safety in 2023 had increased average safety ratings in 2026. This included women, Asian or Pacific Islander, White, and older adults (45 years or older). Families with children of any age also increased their safety rating from a C+ in 2023 to a B in 2026.
While both women and men reported significantly higher feelings of safety than in 2023, the increase was larger for women. This increase resulted in a reduction in the disparity between the ratings women and men gave for feelings of safety at night.
Libraries
Residents continued to give libraries high ratings
2026 Libraries Rating: B+
The library grade represents the average of the main, branch and online library average ratings. In 2026, the average library grade remained a B+ (4.1), as it was in 2023.
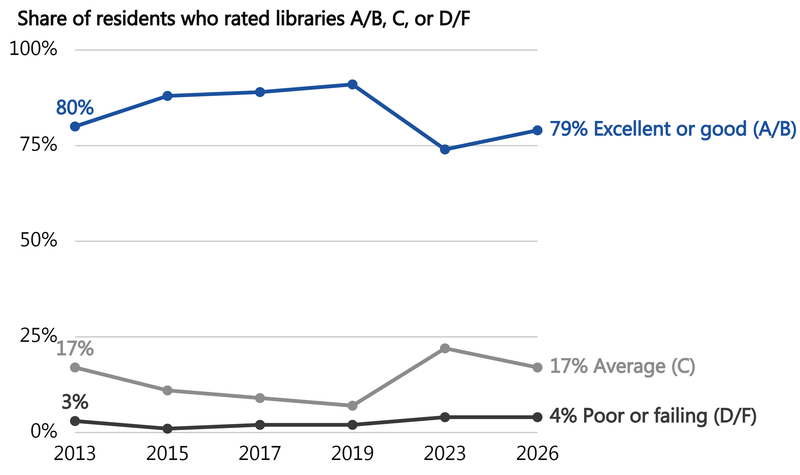
Library ratings did not differ significantly across neighborhoods. Residents in most neighborhoods gave libraries a B or B+ rating.
Library usage at highest rates since 2011
The percent of respondents who reported using the library at least once a year at the main, branch, or online locations was at its highest levels since at least the 2011 City Survey.
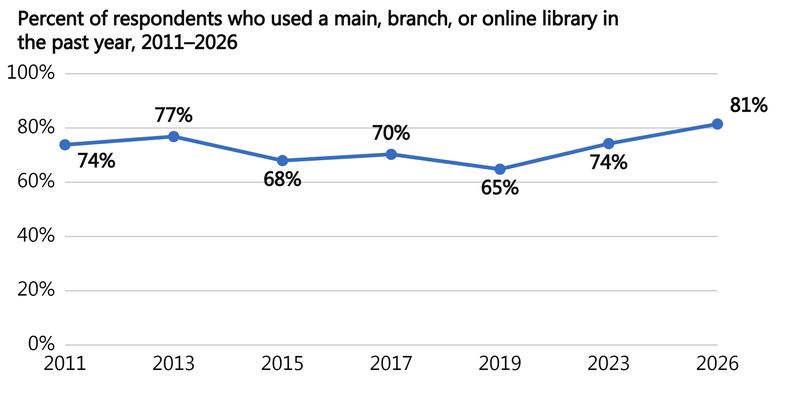
Adults 25-34 and parents of young children had the largest average increases in at least monthly library use. In 2026, 61% of respondents with children aged 0-5 reported at least monthly library use, up from 44% in 2023. In 2026, 53% of respondents aged 25-34 reported at least monthly library use, up from 36% in 2023.
Parks
Average parks rating increased slightly to a B+ in 2026
2026 Parks Rating: B+
Residents remained satisfied with parks, with average ratings increasing slightly from B (3.9) in 2023 to B+(4.0) in 2026. They gave parks consistently “Good” ratings, similar to utilities and libraries. This was true across San Francisco neighborhoods.
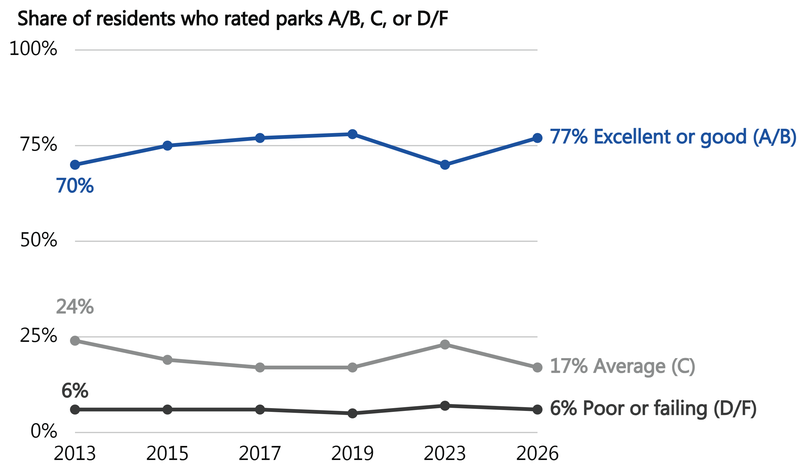
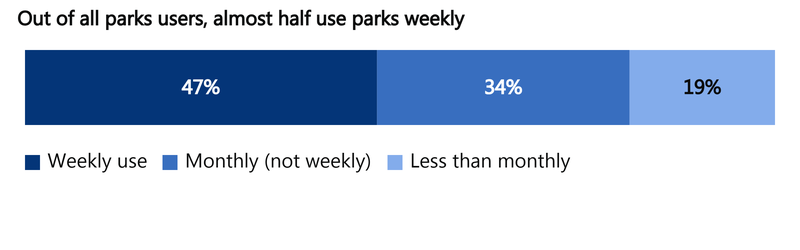
Most residents used parks frequently and rated parks highly
Most residents visited parks: 98% reported they used a park at least once in the past year. Residents across demographic groups gave parks high ratings and reported high park use, including residents with disabilities. Most residents rated parks a B or B+.
Residents most often used parks for "passive" recreation activities
Residents reported visiting parks for many different reasons. This report groups the reasons in two ways
- Active activities, like group sports or official programming
- Passive use of open space, like trails or picnic areas
The most popular responses for why residents visited a park in the last three months were all for passive use types:
- Enjoy nature, trails, or gardens (66%)
- Picnic or meeting friends (40%)
- Dog walking or dog play area (36%)
Transportation
Muni sustained a B- rating
2026 Muni Rating: B-
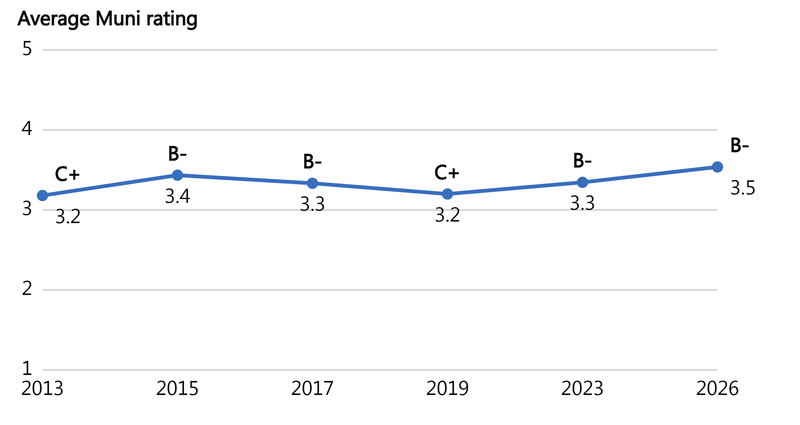
In 2026, the overall average Muni rating was a B-, the same grade in 2023. The average rating increased only slightly from 3.3 in 2023 to 3.5 in 2026. This +0.2 percentage-point increase in the average rating did not move the grade across the threshold from a B- to a B.
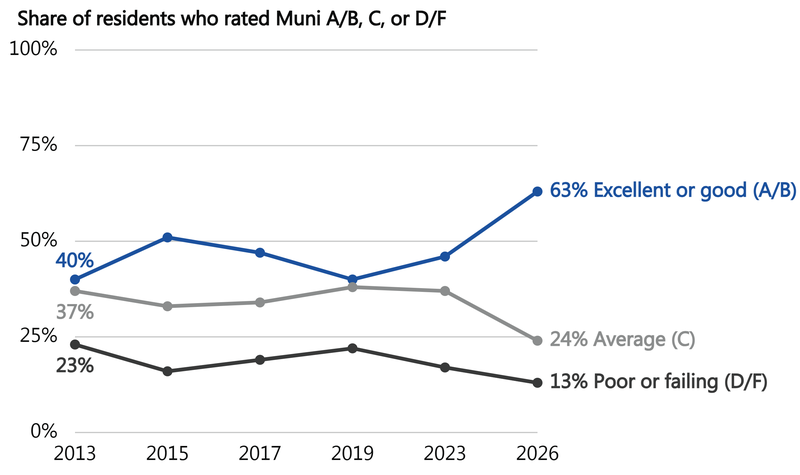
The increase in average rating was driven by a sharp increase in the percent of respondents who rated Muni an A (Excellent) or B (Good).
A majority of San Franciscans used Muni in the past year
In 2026, nearly 88% of residents reported they had used Muni in the past year. This high usage was consistent across income, race, gender, and other demographic groups. Muni use increased slightly from 83% in 2023 to 88% in 2026.
Higher income residents and residents aged 35-44 reported the highest increase in Muni use in 2026. This may be related to local return-to-work mandates and increased office attendance, among other factors.
Adults aged 45-54 and higher income earners had most improved Muni ratings
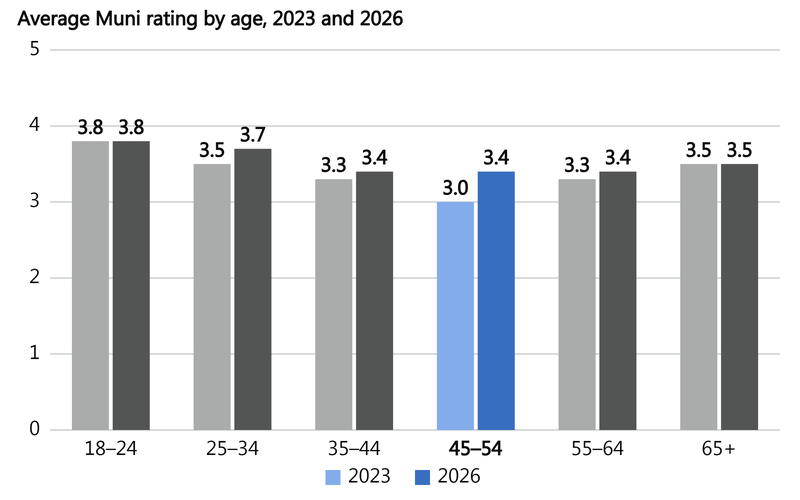
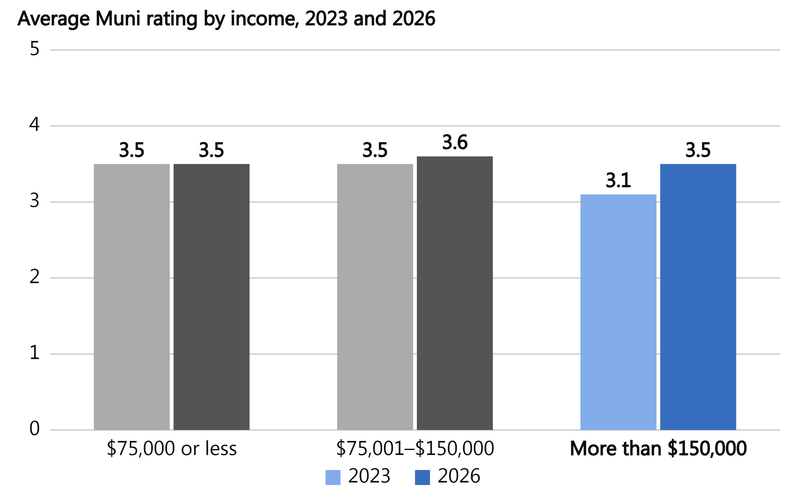
Average ratings increased most among residents ages 45–54 and higher-income residents. To a slightly lesser degree, Black or African American residents and residents with four-year college degrees saw increased average ratings of Muni performance.
Older residents generally gave Muni lower ratings in previous survey years but reported more favorable perceptions in 2026. In 2023, residents aged 45–54 gave Muni the lowest rating of any age group, averaging 3.0 (C). In 2026, their average rating increased to 3.4 (B).
Higher-income earners increased their average Muni rating from a 3.1 (C+) in 2023 to 3.5 (B-) in 2026. Middle- and lower-income earners did not show a significant increase in rating. Therefore, there was no significant difference in average rating between income groups in 2026.
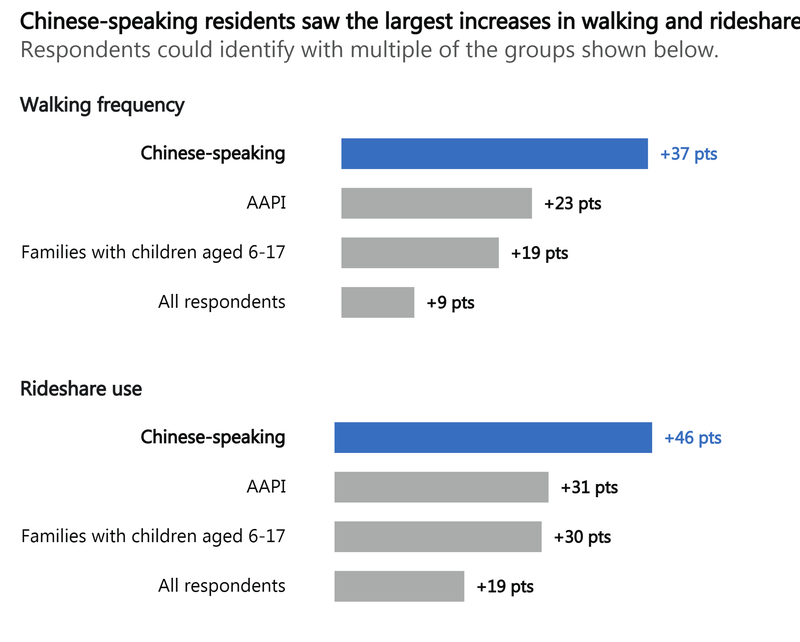
Chinese-speakers, Asian or Pacific Islander residents and families with older children reported significant increases in walking and rideshare
Residents across demographic groups reported frequent walking. Asian or Pacific Islander respondents saw the largest increase in frequent walking by 23 percentage points from 71% in 2023 to 94% in 2026. Similarly, the share of Chinese-speaking respondents who reported frequent walking rose from 55% in 2023 to 92% in 2026. Families with children aged 6-17 reported the biggest increase in walking from 78% in 2023 to 97% in 2026. These three groups also reported significant increases in their use of rideshare services compared to other respondents.
Streets and Utilities
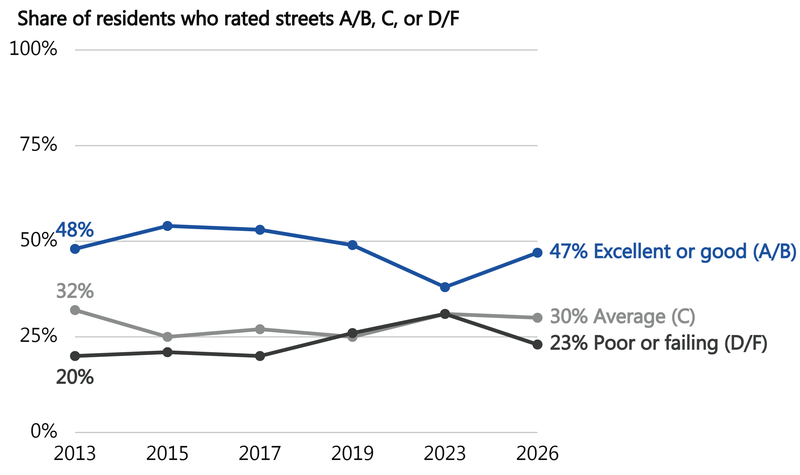
Streets ratings remained stable since 2023
2026 Streets Rating: C+
The Streets grade reflects an average of the average street cleanliness and street condition ratings. In 2026, the average grade was a C+ (3.3), same as in 2023 (3.0).
Utilities ratings remained stable since 2023
2026 Streets Rating: B
The utilities grade reflects an average of the delivery of drinking water and sewer and stormwater services ratings. The 2026 grade of B (4.0) represented a slight decline from a B+ (4.1) in 2023.
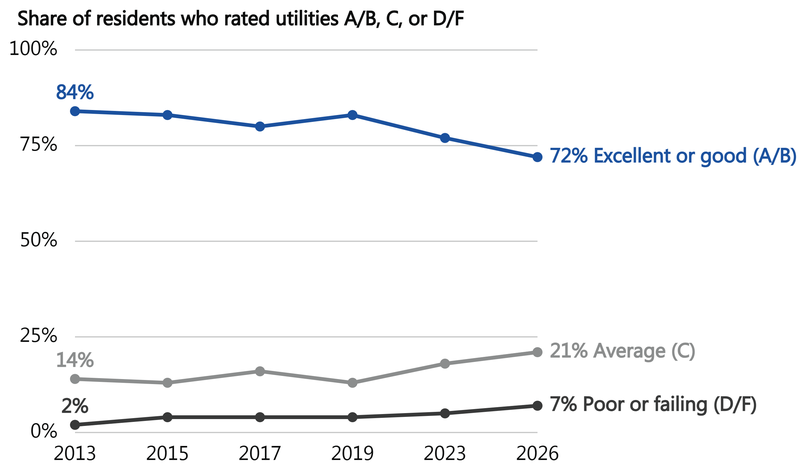
There were no significant differences in utilities ratings across neighborhoods. Most neighborhoods averaged a B or B+ utilities rating from their residents.
Methodology
From April 2026 through June 2026, EMC Research, Inc. (EMC) administered the City Survey. For the 2026 survey, EMC used a random digit dialing (RDD) methodology for calling residents via telephone and an online interviewing strategy. In 2023, City Survey employed in-person intercept interviewing, which was eliminated in 2026 due to potential method bias. Instead of intercept surveys, subcontractor InterEthnica led a public engagement outreach effort to promote the survey at cultural and community hubs around the City. InterEthnica staff offered community members to take the survey online or request a future interview by phone.
Through the above-described survey modes, EMC collected a total of 2,505 responses, computing to a maximum margin of error of ±1.95 percentage points at the 95% confidence interval.
EMC and InterEthnica translated the City Survey into Spanish, Chinese, Tagalog/Filipino, Vietnamese, and Russian.
Data notes
Unless otherwise stated, this analysis defines “frequent” service use as follows for each service area:
- Parks: At least monthly
- Libraries: At least monthly
- Public transportation (formerly just Muni): At least two days a week
- Downtown visitation: At least once a week
Unless otherwise stated, this analysis uses the following flat income brackets (not including household size) when reporting on lower, medium, and higher income earners:
- Lower income: $75,000 or less
- Medium income: $75,001 - $150,000
- Higher income: More than $150,000
City staff used generative AI to assist with categorizing open-ended responses for number one issue facing San Francisco. AI-generated categories were carefully reviewed, verified, and adjusted by staff analysts before report inclusion. Data analyzed with AI assistance did not include personally identifiable information.
Changes in 2026
- Service ratings: In previous years, the City Survey reported utility and streets ratings in a combined infrastructure rating. In 2026, we reported them separately and eliminated the infrastructure rating.
- Downtown: We slightly modified the downtown-related response options. In 2023, City Survey asked respondents how frequently they visited downtown in the last three months. In 2026, City Survey just asked if respondents visited downtown at all in the last three months, without asking about frequency.
Analysis to interpret with caution
The City Survey aims to collect responses from a sample that reflects San Francisco’s local population, per the most recent US Census Bureau’s ACS (American Community Survey) 2024 5-year estimates. We also weigh survey responses to bring the data in line with the City’s actual population distributions. However, some demographic groups and neighborhoods had too few respondents to support reliable analysis with an acceptable margin of error or to report results without the risk or re-identification.
- Neighborhood data: Some San Francisco neighborhoods had relatively small populations, which can result in small numbers of survey respondents. While we may include service ratings in the [neighborhood data dashboards], we do not interpret results or provide analysis for neighborhoods with a response rate of less than 15. We continue to collect responses from residents of all neighborhoods so that they are represented in citywide results.
- Demographic data: We similarly do not report service ratings for demographic groups with fewer than 30 respondents. In the 2026 dataset, responses from trans men and trans women were combined with the broader woman and man categories for service ratings because the individual groups did not meet the 30-respondent threshold.
How to interpret the results
Most outcomes in the City Survey are ratings with the grade associated developed by averaging responses to create a mean score using a five-point grading scale (A+ equals five points and F equals one point).
Numeric to letter grades
The 2026 City Survey findings summarize resident satisfaction with City services using a letter grade system. The grade associated with each City service in this report reflects the average of each rating to create a mean score using a five-point grading scale (“A+” equals five points and “F” equals one point). The table below details how these mean scores translate into the letter grades presented in the survey results.
| Letter Grade | Lower Mean | Upper Mean |
|---|---|---|
A+ | 5.00 | 5.00 |
A | 4.67 | 4.99 |
A- | 4.33 | 4.66 |
B+ | 4.00 | 4.32 |
B | 3.67 | 3.99 |
B- | 3.33 | 3.66 |
C+ | 3.00 | 3.32 |
C | 2.67 | 2.99 |
C- | 2.33 | 2.66 |
D+ | 2.00 | 2.32 |
D | 1.67 | 1.99 |
D- | 1.33 | 1.66 |
F | 1.00 | 1.32 |
The three main ways the City reports the results are with a weighted mean from this scale, the corresponding letter grade, or the weighted percent of respondents who graded a service an A or B. Weights are used in the reporting to control for any differences between the demographics of the respondent sample and the overall population of San Francisco.
Results in this report for previous years may not match the exact number from earlier publications. Over the years the City modified exactly where and how weights are used in calculating outcomes depending on what is most appropriate for the most recent data. While most service ratings are now based on a single, overarching question, some are based on the average of multiple rating questions. The exact questions used to calculate ratings have changed over time, though the City has worked to keep year over year comparisons as similar as possible.
For more detailed information please see the full dataset and dictionary or the detailed methodology.
Data and Previous City Survey Reports
Find out more with these data dashboards on Overall Government Services, Safety, Muni and Transportation, Streets and Sidewalks, and Neighborhoods.
Visit the City Survey homepage to see information on past years.
Download the full dataset.