Meeting Information
City Hall, 1 Dr. Carlton B. Goodlett Place, Room 408, San Francisco, CA 94102
Call to Order
- 9:02 AM
Roll Call
- Carol Isen, Human Resources Director (Represented by Kate Howard) - Present
- Anna Duning, Mayor’s Budget Director (Represented by Matthew Puckett) - Present
- Carmen Chu, City Administrator (Represented by Mark Hennig) - Present
- Erik Rapoport, Deputy Executive Director, San Francisco Employee Retirement System - Present
- ChiaYu Ma, Deputy Controller, Controller’s Office (Represented by Devin Macaulay) - Present
- Matthew Barravecchia, Deputy City Attorney, City Attorney’s Office - Present
Item No. 1 - Public requests to speak on any matter within the jurisdiction of the Workers’ Compensation Council appearing on the agenda
Speaker: Kate Howard, Managing Deputy Director
Council Comment:
None.
Public Comment:
None.
Item No. 2 - Approval with possible modification of minutes
Erik Rapoport motioned to approve the minutes from the meeting held August 5th, 2024. The motion was seconded by Mark Hennig.
Action: The August 5th, 2024, minutes were approved unanimously.
Item No. 3 - Report from the Workers' Compensation Division
Workers’ Compensation Director Julian Robinson was called to present the report from the Workers’ Compensation Division.
Speaker: Julian Robinson, Deputy Director, Workers’ Compensation Division
Report on Accomplishments, Challenges, and Initiatives, Return-to-Work Program, Performance Quick Facts, Financials, and Claim Analytics.
Julian Robinson, Director of Workers’ Compensation, greeted the council and introduced himself. He explained the report presentation will be a summary of Workers’ Compensation Division Quarter 1 accomplishments, initiatives, and Temporary Transitional Work Program (TTWA.) Next, Department CFO Mike Cotter will present performance quick facts and financial reports. Lastly, Julian Robinson will return to discuss claim analytics and trends.
The FY 2024-2025 quarter one slide presentation was sent in advance for council members to review prior to the meeting. The City and County of San Francisco Workers’ Compensation Division had an active quarter focusing on Catastrophic Illness updates that are pending BOS approval. This quarter we also focused on streamlining, reporting and succession planning by actively recruiting for eight staff positions which are vacant or will soon be vacant.
Police and Fire ADR Program actuarial reports from FY 2022-23 are awaiting final review. In a response to an increased number of assault claims and mental health claims, WCD continues to focus on access to mental health care in the ADR program and citywide by adding ten mental health providers and expanding mental health access.
The WCD division completed several contracts for service providers and an RFP for investigative services targeted for Q3 FY25.
Director Robinson next discussed current WCD Temporary Transitional Work efforts, findings, challenges and next steps. WCD met and educated existing MPN providers, focusing on those who consistently struggle with providing temporary restrictions. As we vet and add providers to our MPN and ADR program, we take the opportunity to educate them on expectations and importance of providing timely temporary modified duty restrictions. Continued tracking in claims system delivers data to drive outcomes and bring more success into the program.
From May 2023 to current, TTWA data analysis shows:
- 93% of claims reported were eligible for modified duty
- 74% of tracked claims were accommodated for modified duty, and 26% were not
Key findings have found that an average of 93 additional lost days per claim were incurred where modified duty was not accommodated by the department. This amounts to an average of $31,329 per
claim in additional lost time benefits. Modified duty, even for a temporary period, provides cost savings to the claim.
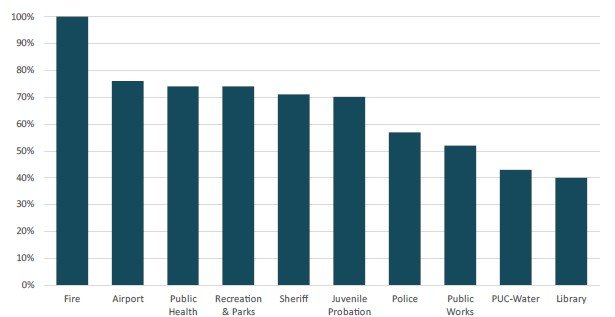
Julian Robinson next presented the percentage of TTWA accommodation provided by the top ten departments during Q1 FY24-25. Fire, Airport and Public Health lead timely modified duty in the first quarter. In fact, the Fire department accommodates 100% of staff in need of modified duty based on data available in Q1. Sheriff and Juvenile Probation showed improvement in accommodating modified duty as well.
Managing Deputy Director Kate Howard requested questions or comments from the council about the return-to-work report.
Council Comment:
Matthew Barravecchia asked if the city can communicate across departments to provide options when a non-safety employee is seeking modified duty accommodations? Julian Robison explained that this happens informally, but formally, a position may be required to staff a DHR liaison solely dedicated to managing cross departmental modified duty needs.
Kate Howard referred to the TTWA findings graph, and confirmed the city-wide average is 74% and a few departments are below average. She confirmed from Julian Robinson that the top ten departments are decided by number of claims.
TTWA Findings
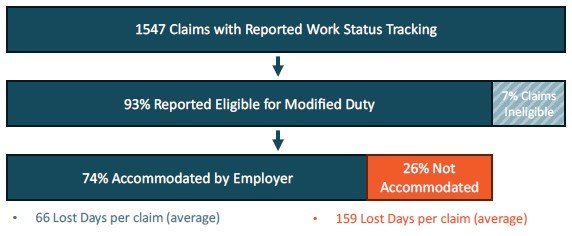
Key Findings:
- Average of 93 additional lost days/claim incurred where modified duty was not accommodated by the department
- Average of approximately $31,329 per claim in additional lost time benefits paid when not accommodated
Percentage of TTWA Accommodation provided by the top 10 departments
Next, Department CFO Mike Cotter presented a summary of FY Q1 high level performance quick facts.
For the first quarter, we started to see cost savings due to the previous initiatives such as expanding our medical provider access, return to work and modified duty programs. First quarter spending came in at 77% to budget. However, what is not included are some of the rate cost increases largely around temporary disability, and some one-time Compromise and Release (C&R) payments. These C&Rs are challenging to forecast and could result in either cost savings or cost expenditures.
Indemnity expenditures have increased compared to benchmark. This corelates to the indemnity cost closed-claim metrics as well. Indemnity claims usually cost more because they have a longer duration. The 4850 labor code allows for one-year full payment of salary in aggregate. There has been a spike in 4850 salary continuation pay, however this is a fiscal number paid by the department, not from workers’ compensation finances. We plan to analyze what the cost projection could mean to indemnity for workers’ compensation and the true fiscal impacts to departments in the next quarterly council meeting to determine cost increase or savings overall.
Council Comment:
Matthew Barravecchia asked for clarification on the 4850 salary continuation numbers. Mike Cotter explained DHR plans to further analyze expanded data and analytics. If the departments, not workers’ compensation, are taking on 4850 expense liability, we need to study if there is there a savings at the city level or a cost increase overall.
Julian Robinson returned to the podium to present detailed claim analytics and trends. In the first quarter, claim filing is up about 7% overall. However, the citywide injury rate remains steady at 11 per 100 employees. Fire FTE was once at a height of 60 and is now 31/100. Sheriff is newly 20/100, Police FTE is up, and Public Health is significantly up to about 14 full time equivalent claims filed per 100 FTE which is now above the Citywide average. Having hired additional staff helps keep this Public Health severity rate increasing further.
Julian Robinson shared data on the top ten claim cause injuries, as requested from last quarter’s council meeting. The largest cause is Bodily Motion which includes moving around such as getting in and out of vehicles, twisting, and turning. The next frequent claim cause is Exposure which includes exposure to carcinogens which cause cancer and exposure to COVID-19 since 2021. Physical assault claims are up within Public Health and Police, followed by Sheriff.
Focusing on litigation statistics, litigated claims tend to cost more than non-litigated claims because they may include additional body parts or require specialty evaluations and depositions. The citywide average representation rate is 35% down from 45%, and the citywide litigation rate average is 20%. Quarter one litigation rates for police were 5% and for Fire were 4%, both reduced from prior years, due to the benefits of the Alternative Dispute Resolution (ADR) program.
Julian Robinson then returned the meeting to Deputy Director Howard, who requested questions or comments from the council.
Council Comment:
Mark Hennig asked if the previously mentioned (litigation rate of) 45% includes or excludes the significant drop in Police and Fire? Julian Robinson replied the 45% was citywide, including police and fire, but before the creation of the Alternative Dispute Resolution (ADR) program.
Matthew Barravecchia asked if a hearing request is to be considered litigated vs. represented. Julian Robinson replied that yes, litigated means it goes to trial, hearing, mandatory settlement conferences, or mediation within the ADR program. These two rate results are presented separated because sometimes injured workers do not have attorneys but still litigate their claims, and sometimes an injured worker who is represented will settle their claim or not go to court. Matthew Barravecchia said he is interested to see how the data can help and improve the ADR program and WCD program.
Public Comment:
None.
Item No. 4 - Report from the San Francisco Municipal Transportation Agency Workers' Compensation Division
Speaker: Jim Radding, San Francisco Municipal Transportation Agency Workers Compensation Manager
Report on Accomplishments & Initiatives, Challenges, Covid-19, Performance Quick Facts, Claim Analytics and Financials
Jim Radding, the Workers’ Compensation Manager for SFMTA, welcomed attendees and introduced Intercare representatives Andy Matthews and Michelle Meadors. The agenda included updates on accomplishments, initiatives, challenges, performance metrics, claims analytics, and financials.
Claims Review Updates:
Focus on 24-Month-Old Claims
A key emphasis for the upcoming claim review is targeting claims older than 24 months. The team aims to identify actionable steps, such as QMEs, settlements, or other resolutions, to close these claims.
Monthly Review of New Claims
A monthly review is conducted for new claims within 30 days of filing. This includes the claims manager, supervisor, examiner, and nurse case manager. The focus is on facilitating light duty, pushing toward MMI, or enabling a return to full duty.
Key Initiatives
LightSpeed Initiative
This initiative ensures claims are reported promptly. The Transit Management Center (TMC) send information to the investigation company and get the initial claims to Intercare immediately, allowing quicker benefits to the injured worker and obtaining, coach videos, inspector and police reports.
Nurse Case Management Program
A telephonic nurse case manager is assigned to every lost-time claim. The nurse coordinates with the doctor, the injured worker, and the SFMTA team to develop treatment plans and facilitate return-to-work strategies. Last quarter, there were 134 new referrals to this program.
Accomplishments
Claims Processing and Training
The LightSpeed program has significantly reduced claim setup time. Intercare processes claims quickly, achieving a strong four-day turnaround time. Additionally, ongoing training for supervisors and new employees ensures a comprehensive understanding of workers' compensation procedures and investigations.
Pharmacy Cost Reductions
The program has successfully reduced pharmacy costs while maintaining care quality.
Settlements and Recoveries
Last quarter, 41 claims were resolved through stipulation awards, and 32 were settled via compromises and releases.
In addition, we received subrogation recovers of $141,143.
Transitional Work Program (TWP)
The TWP supports 35–50 employees weekly, placing them in modified duty roles for 90 days. Employees gain new skills, such as computer proficiency, while contributing to the agency. Many transition to their usual and customary roles within SFMTA, achieving faster recoveries and saving costs.
Partnerships
Focus on Psychological and Pain Management
SFMTA collaborates with psych doctors and pain management specialists to expedite care. Monthly meetings with the medical facilities, helps the Intercare team to address issues and build strategies for improved recovery outcomes for the employee.
Current Challenges
Increased Union Wages and COLA
Union wage increases and a 3.77% COLA adjustment effective January 1 have raised the maximum temporary disability rates.
Expanding TWP Assignments
Finding more transitional work placements remains a priority, requiring coordination with divisions to identify suitable roles.
Assault and Mental Health Claims
Assault claims have increased, necessitating quick mental health referrals and evaluations. Efforts are ongoing to address this trend and support affected employees.
Performance Metrics
Claim Volume and Costs
Indemnity claims rose by 4% (seven additional claims), while medical-only claims increased by 6% (three additional claims). Quarter 1 FY 2025 saw $28,296 in closed claim costs, compared to $17,952 in FY 2024.
Litigation Trends
Litigated claims rose by 2% to 642 open cases. The average cost of litigated claims is $106,000, compared to $12,000-$16,000 for non-litigated claims.
Budget Overview
The FY 2025 budget is $36.4 million, an increase from $29.7 million in FY 2024. Expenditures are slightly above budget this quarter. Payments for temporary disability reached $4.4 million, permanent disability $1.8 million, and medical costs $3.2 million.
Assault and Injury Trends
Transportation employees and Parking Control Officers (PCOs) experience the highest assault rates due to public-facing roles. Vehicle incidents remain the second leading cause of claims, followed by slip, trip, and fall injuries.
Long-Term Claims
There are approximately 530 claims older than 24 months. Efforts focus on moving these claims toward resolution through MMI, QMEs, or settlements. About half of these claimants have returned to work. Many are open for New and Further filed by the Applicant Attorney and are aggressive being pursued to resolve by Intercare.
Closing Remarks and Q&A
Jim concluded by summarizing key points and opened the floor for questions. Highlights included clarifications on claim timelines, assault comparisons, and strategies for resolving older claims.
Public Comment:
None.
Item No. 5 - Opportunity to place items on future agendas
Speaker: Kate Howard, Managing Deputy Director
Council Comment:
None.
Public Comment:
None.
Item No. 6 - Opportunity for the public to comment on any matters within the council’s jurisdiction
Council Comment:
None.
Adjournment
Managing Deputy Director Kate Howard adjourned the Workers’ Compensation Council meeting.
The next Workers’ Compensation Council meeting will be held Monday, February 3rd, 2025, at City Hall, at 9:00 a.m. in room #408.
The meeting was adjourned at 9:59 AM.