Meeting Information
City Hall, 1 Dr. Carlton B. Goodlett Place, Room 408, San Francisco, CA 94102
Call to Order
- 9:00 AM
Roll Call
- Carol Isen, Human Resources Director - Present
- Carmen Chu, City Administrator (Represented by Mark Hennig) Present
- Erik Rapoport, Deputy Executive Director, San Francisco Employee Retirement System - Present
- Chia Yu Ma, Deputy Controller, Controller’s Office (Represented by Devin Macaulay) - Present
- Matthew Barravecchia, Deputy City Attorney, City Attorney’s Office (Represented by Dyana Lechuga) - Present
Item No. 1 - Public requests to speak on any matter within the jurisdiction of the Workers’ Compensation Council appearing on the agenda
Speaker: Carol Isen, Human Resources Director and Chair of the Workers’ Compensation Council
Council Comment:
None.
Public Comment:
None.
Item No. 2 - Approval with possible modification of minutes
Erik Rapoport motioned to approve the minutes from the meeting held May 6th, 2024. The motion was seconded by Dyana Lechuga.
Action: The minutes from May 6th, 2024, were approved unanimously.
Item No. 3 - Report from the Workers' Compensation Division
Workers’ Compensation Director Julian Robinson was called to present the report from the Workers’ Compensation Division.
Speaker: Julian Robinson, Deputy Director, Workers’ Compensation Division
Report on Accomplishments and Initiatives, Return-to-Work Program, Performance Quick Facts, Financials, and Claim Analytics.
Julian Robinson greeted the council. He explained a plan to brief the council on the Workers’ Compensation Council’s purpose. He would then summarize accomplishments, initiatives, and updates on the Temporary Transitional Work Program. Mike Cotter, CFO for the Department of Human Resources, would next discuss performance facts and financials, followed by Arnold Pacpaco, Assistant Director of Claims Operations, sharing claims analytics.
On January 1, 1995, DHR took over the Workers’ Compensation Division. Administrative Code 16.82 and 16.83 established the council's oversight powers on costs and procedures. Advisory members were selected from a larger task force and include:
- Human Resources Director (Chair)
- City Administrator
- Controller
- City Attorney
- Retirement System – Executive Director
- Mayor’s Office - Director of Budget and Finance
The council requested audits and submitted progress reports to the Board of Supervisors. These reviews ensure oversight to manage workers’ compensation costs.
Carol Isen asked if annual reports are currently submitted to the Mayor and Board of Supervisors.
Julian Robinson confirmed that in the past, audits and reports were discussed and then submitted, but this has not been done in recent years. Julian Robinson shared three key accomplishments in workers’ compensation: improved program administration and controls, a city-wide closure ratio of 102.5%, and a passing score of 0.97029 in a mock audit. Additionally, our modified duty program avoided over $27 million in benefits, as the average additional claim cost is about $30,000 when modified duty is not accommodated.
Fiscal Year 2024-2025 initiatives include enhancing our Alternative Dispute Resolution program for Police and Fire, as well collaborating with medical providers, adjusters, and city departments on temporary modified duty. We will focus on succession planning, backfilling positions, and developing a training academy for internal growth.
Workers’ compensation is working with departments on our modified duty report to solve issues and improve tracking. Currently, 93% of claims are eligible for modified duty. Of those, 73% have been accommodated by departments. Not accommodating modified duty can cost over $30,000 per claim in additional lost time benefits. Workers’ compensation started tracking modified duty in May 2023 to collect data on accommodations and work restrictions. We have data in our central claim system through June 2024.
Slide 13 shows the days lost due to temporary disability and payments, with bars showing average dollar amounts per lost day over five years and an orange line for the number of days. Workers' comp had statutory wage increases every year except 2024. There were significant increases in the temporary disability rate from 2021-2023, along with city wage hikes. Nonetheless, accommodating modified duty can reduce lost time days to help lower costs, even with steady or rising rates.
TD Lost Days and Payments
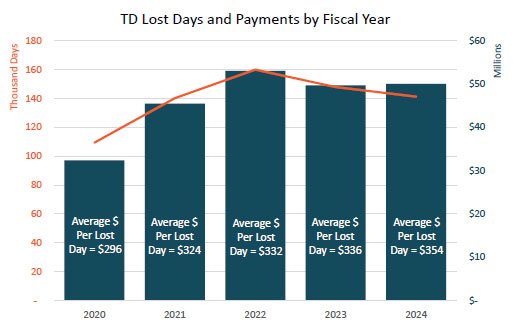
Notes:
- TD lost days calculation includes temporary disability payments and 4850 ("Disability Pay") payments.
- Payment data from SFMTA are excluded.
When possible, departments offer modified duty opportunities. However, there can be challenges with certain rules. For instance, a ‘no repetitive typing’ rule might impact a 911 dispatcher, and probation or sheriff staff may not be allowed to work with inmates. There may also be accommodations in other departments that we don't know about. WCD aims to create a citywide task bank for long-term access to information that could help with modified duty accommodations across departments.
Erik Rapoport noted that "accommodated" has a specific meaning. On the Reasonable Accommodation (RA) side, it means essential job tasks, while here it refers to a temporary light duty assignment. Understanding this is crucial for employees transitioning to the RA side. This doesn’t imply departments are finding jobs for essential tasks. Workers' comp and ADA can collaborate, although there is a difference between temporary modified duty and permanent restrictions.
The ADA program can work with workers' comp if someone is off work long enough, or on temporary modified duty. The TTWA accommodates modified duty up to 90 days, and it is extendable to 180 days. Police and fire departments have modified duty programs for up to 365 days, after which they do not accommodate. This limits accommodations to avoid confusion with permanent ones.
Carol Isen asked to revisit slide 12 and discuss the 27% of ineligible claims.
TTWA Early Findings
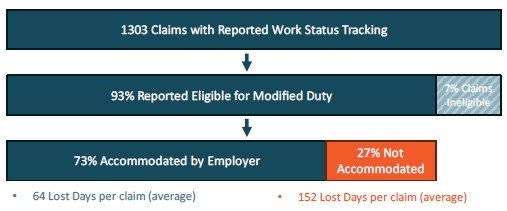
Key Findings:
- Average of 88 additional lost days/claim incurred where modified duty was not accommodated by the department
- Average of approximately $30,721 per claim in additional lost time benefits paid when not accommodated
The 27% of ineligible claims shows employees who can work, with limits, yet the department could not find a position to offer the employee. Julian Robinson clarified to the council that if the department is unable to accommodate restrictions, we must continue to pay benefits. However, if the department can accommodate yet the employee declines an assignment, we will not provide temporary disability benefits.
Mike Cotter, CFO of Human Resources, was introduced to discuss performance facts and insights. He emphasized that we are focusing on data, processes, and controls to identify weaknesses and maintain a good reputation.
Workers’ Compensation Division uses four metrics: budget health, claim volume, claim cost, and duration. In the past fiscal year, we spent less than expected due to cost deferment and strategy.
The benchmark is a rolling four-year average. Changes include temporary presumptions like COVID, which ended in December 2023, but costs remain. New presumptions like cancer and PTSD emerged in 2020, so the four-year impact isn't visible yet. Workers’ compensation aims to refine fiscal presentations to show variables as new presumptions affect costs. Claim volume and costs have increased over the last two years, while medical claims have decreased, providing a basis for further discussions in upcoming council meetings.
In the past four years, workers’ compensation spent more than planned but saved in the general fund. Claim volume shows how many claims we receive. There's a slight increase in indemnity volume and claim costs, but smaller in dollar amounts. The average claim is open for 319 days.
FY24 Q3 Performance Quick Facts
Fiscal Health
Ratio of Actuals to Budget
FY24 Q3 103%
Benchmark: 95%
Claim Volume (Count of new claims in period)
| Indemnity | Medical | |
|---|---|---|
FY24 Q3 | 588 | 172 |
Benchmark | 529 | 178 |
Claim Cost (Average cost of claims closed in period)
| Indemnity | Medical | |
|---|---|---|
FY24 Q3 | $15,629 | $720 |
Benchmark | $11,746 | $710 |
Duration (Average days open of claims closed in period)
| Days | |
|---|---|
FY24 Q3 | 319 |
Benchmark | 199 |
Notes:
All benchmarks based on rolling four-year average (FY20-23). Fiscal health metric includes overhead and claim expenditures and is based on original budget, excluding any carryforward. Duration excludes disability retirement and future medical claims.
You will see an increase in permanent disability and medical cases compared to the last two years. A big part of this was due to one major police claim. Closing this claim will save costs in future years because settling for a lump sum is usually cheaper than paying it out over time.
Benefit Expenditure Trends by Dept
| Department | FY23 Actuals | FY24 Revised Budget | FY24 Projected Actuals | FY24 Projected Surplus / (Deficit) | FY24 Projected YOY Change |
|---|---|---|---|---|---|
Police | 21,219,758 | 23,518,565 | 28,247,307 | (4,728,742) | 7,027,549 |
Fire | 15,434,996 | 19,745,818 | 17,352,088 | 2,393,730 | 1,917,092 |
Public Health | 17,621,380 | 19,529,775 | 19,1220,044 | 409,731 | 1,498,664 |
Sheriff | 8,732,773 | 9,194,384 | 8,827,405 | 366,979 | 94,632 |
Public Works | 5,232,696 | 5,582,304 | 4,805,599 | 776,704 | (427,097) |
Airport | 5,430,115 | 5,460,365 | 4,865,539 | 594,826 | (564,576) |
Recreation & Parks | 4,177,684 | 5,190,316 | 3,445,702 | 1,744,614 | (731,982) |
Human Services | 3,160,362 | 2,944,000 | 2,899,680 | 44,320 | (260,682) |
PUC-Wastewater | 2,524,332 | 2,709,668 | 1,971,399 | 738,268 | (552,933) |
PUC-Water | 2,565,732 | 2,632,268 | 2,342,912 | 289,356 | (222,820) |
Total Top Ten Departments | 86,099,827 | 96,507,464 | 93,877,677 | 2,629,787 | 7,777,850 |
Total of All City Departments | 97,283,839 | 109,591,433 | 105,875,121 | 3,716,311 | 8,591,282 |
Notes:
- Expenditures exclude LC4850 salary continuation benefits and SF Community College, and include program overhead
- Department sorted by FY24 Revised Budget
Fire had a one-year carry forward into the last fiscal year. While there is a surplus, it will not continue into future years as the one-time carry forward does not apply next year. Carol Isen commented that PUC has been broken up into two divisions: wastewater and water. The Finance team may talk with the Controller’s office to see if we may want to roll these into one line. Next, Assistant Claims Director, Arnold Pacpaco presented claim analytics and claims filing frequency. Citywide average claims hold steady at about 11 per 100 FTE. Police and Fire are returning to pre-pandemic levels. Sheriff and Public Health have increased, so we are engaging with them to discuss risk management and safety practices. From 2020 to 2023, annual claims averaged 2,800. In fiscal year 2024, claims rose to 2,877, a 3% increase. Partners like DPH and Fire saw significant increases, while Police and the Sheriff’s Office had decreases. Despite increased filings, many future medical claims were successfully closed. Citywide, litigation rates dropped by 23% due to the creating of the Alternative Dispute Resolution (ADR) program mid-2019. Since that time, the Police Department's litigation rate dropped from 53% to 7% while the Fire Department's litigation rate fell from 35% to 4%. Rather than going to lawyers, injured workers instead can go to an Ombudsperson who is able to provide clarification and guidance, resulting in reduced litigation rates. Citywide assault claims decreased from FY 23 to FY 24. There were 173 assault claims filed in fiscal year 2023 which went down to 165 in fiscal year 2024. Assault payments fell from $5,566,256 in 2023 to $4,000,711 in 2024. Julian Robinson added that anti-assault signage was created and posted to mitigate workplace violence. In about a year from now workers’ compensation will be able to determine the true impact of these signs. Mr. Pacpaco then returned the meeting to Director Isen, who requested questions or comments from the council.
Council Comment:
Carol Isen asked the division to share which departments have the most assaults.
Public Comment:
None.
Item No. 4 - Report from the San Francisco Municipal Transportation Agency Workers' Compensation Division
Speaker: Jim Radding, San Francisco Municipal Transportation Agency Workers Compensation Manager
The next item on the agenda is a report from the SFMTA Workers’ Compensation Commission. I'm Jim Radding, the Workers' Compensation Manager for SFMTA, and our thirdparty administrator is Intercare. We’ve got some of our supervisors here today—Laurie Burnside and Dawn Owens—as well as the account manager, Michelle Meadors. I’m going to walk you through our accomplishments, initiatives, challenges, and some performance highlights.
So, let’s get started with an overview of the fiscal year. One of our primary goals has always been to take care of our employees, helping them navigate the process and exit the system as quickly as possible. We’ve been working hard on a few initiatives to make that happen.
Accomplishments & Initiatives:
• File Review Initiatives:
First, we have quarterly follow-up reviews with Intercare, and we focus on files that are over 24 months old to see how we can close those out. In addition, we hold monthly reviews of temporary disability claims, especially those that are around the 30-day mark, to strategize on how we can get employees back to work sooner. Our team—which includes a supervisor, a claim examiner, and a nurse—goes over each file to see what can be done.
• Lightspeed Initiative
Another big push is our "Lightspeed Initiative," which I’ve mentioned before. It involves our rapid response approach, where we get investigators out to collect reports, coach videos, statements, and pictures as quickly as possible. We gather all this information and send it to Intercare so they can start processing the claim right away. This has helped cut down delays and ensure benefits are paid faster.
• Early Intervention Program:
We also have an Early Intervention Program. This includes a telephonic nurse who calls injured employees right away, helps them work through their medical issues, and plans their treatment and return to work. What we’ve noticed is that employees really appreciate talking to a nurse—someone caring who can help them through this difficult time. This has sped up the process and helped us get them back to work more quickly.
Transitional Work Program:
In terms of our Transitional Work Program, we’ve got about 30 to 50 employees actively participating in the 90-day light duty program. We’ve expanded this to include roles like data entry, answering phones, and helping with parts in our department. For example, employees working in the parts department help with putting parts away, delivering them, and doing some computer work with invoicing This program has saved us a significant amount of money for SFMTA— around $500,000 plus—by bringing people back to work in light-duty roles. That’s something we’re proud of.
• Reduction in Temporary Disability Payments:
On top of that, we’ve seen a 7% reduction in temporary disability costs compared to the last fiscal year. This is largely thanks to our early intervention efforts, the light-duty program, and getting people back to work sooner, which also helps lower litigation costs.
• Job Analysis Updates:
We’ve also been working on updating our job analyses. The old ones were about 15 years old, and frankly, they weren’t very useful. We’re creating more detailed job descriptions that help doctors better understand what employees can and can’t do when they’re returning to work. This helps us get more accurate restrictions, which in turn helps us manage claims better.
• Claims Lag Time
One other positive outcome I’d like to mention is that our average lag time from when a claim is reported to when Intercare gets it is down to just 3.75 days. That’s a big improvement and means we can get the investigation going and pay benefits sooner and timely. The sooner we pay people, the better off they are.
• Ongoing Training Initiatives
We’ve also been training supervisors across various divisions, explaining what workers' comp is, how it works, and how to file claims correctly. I also give a little intro to workers’ comp during orientation for new transit drivers to make sure everyone’s on the same page and understands work compensation and how to report injuries when they occur.
Challenges
Another challenge we’ve faced is that our budget didn’t line up with what we actually spent for the year. We’re going to be adjusting those numbers moving forward, but this fiscal year saw an 8.5% increase in overall costs. A lot of that has to do with temporary disability and wage increases, so we’re going to keep looking into ways to manage that better. We discussed several challenges in the program. First, the recent wage increases have impacted the costs of temporary disability benefits, making it more expensive to cover these claims. Another issue is the limited availability of transitional work. We’re finding it difficult to place injured workers in light-duty roles, and we need more options to accommodate them. Additionally, finding enough facilities to provide mental health treatment remains a challenge, as there are not enough adequate resources available.
Performance Quick Facts:
In terms of performance, we saw 583 new indemnity claims in fiscal year 2024, which is a slight increase from the previous year. The average cost of closed claims has risen from $21,000 in 2023 to $25,000 in 2024. On the positive side, we recovered via Subrogation $485,000 during the fiscal year.
• Closings and New Claims
This fiscal year, 772 claims were closed. There were 635 new claims, reflecting a 4% increase compared to fiscal year 2023, where there were 613 new claims.
Claim Analytics
• Indemnity Claims and Lost Time
Indemnity claims are associated with lost time, typically for full-time employees. For every 100 employees, there were approximately 10.7 claims. Currently, there are 5,965 full-time employees.
• Top Incident Categories (Claim Cause Distribution)
The most frequent types of claims are assaults, particularly among Transit Operators and PCOs. Other notable categories include physical incidents and repetitive motion injuries.
• Open Claims Stratification
Of the open claims, 630 claims fall below $100,000 in costs. Moving higher in cost, 55 claims range between $100,000 and $200,000, while 219 claims are valued between $250,000 and $500,000. At the upper end, there are 16 claims valued at over $1,000,000.
• Open Active Indemnity vs. Future Medical
Currently, 28% of open claims are settled and are future medical claims. About 72% of open claims are indemnity claims and are not settled. Total paid amounts show 52% being medicalrelated, while 48% pertain to indemnity claims. The total incurred costs are distributed at 53% for medical and 47% for indemnity claims.
• Litigation Trends:
Regarding litigation, we’ve seen a 5% drop in the number of active litigation cases, which is a big win. We’ve settled quite a few cases this year, many of them through stipulations and compromise and release (C&R) agreements. In fact, we had seven dismissals, which is great, and the City Attorney’s Office deserves a lot of credit for that. There has been a reduction in litigated claims. As of June 2023, there were 661 unsettled litigation claims, down to 631, representing a 5% reduction.
• Litigation vs. Non-Litigated Clam Costs:
We also touched on litigation costs. Litigated claims are significantly more expensive, averaging $105,000 per claim compared to $16,776 for non-litigated claims.
Financial Overview:
Financially, we noted that the workers' compensation budget did not align with actual expenditures for the fiscal year, and budget adjustments are expected in the coming quarter. Payments for temporary disability have decreased by 7%, ($1.2 million) while settlements have permanent disability increased, which is seen as a positive development because it helps close cases and reduces long-term exposure. Medical costs and expenses have risen.
That’s the summary of where we’re at. Thanks to the council for your attention, and if anyone has any questions or thoughts on how we can move forward, I’m happy to discuss them.
Jim thanked the Workers’ Compensation Council for their time.
Council Comment:
Carol Isen asked Jim Radding if due to higher cost claims, the SFMTA has considered an ADR Program. Jim Radding said after consideration, the ADR program is not a fit for SFMTA.
Public Comment:
None.
Item No. 5 - Opportunity to place items on future agendas
Speaker: Carol Isen, Chair
Council Comment:
None.
Public Comment:
None.
Item No. 6 - Opportunity for the public to comment on any matters within the council’s jurisdiction
Public Comment:
None.
Adjournment
Director Carol Isen thanked the council and presenters.
The next Workers’ Compensation Council meeting will be held Monday, November 4th, 202, at City Hall, in Room 408 at 9:00 AM.
The meeting adjourned at 10:10 AM.